

The National Endowment for the Arts (NEA), in conjunction with the U.S. Bureau of Economic Analysis (BEA), has released its annual update on the national and state-level contributions of the arts and cultural sector to the nation’s gross domestic product (GDP). The new data looks at the contributions of the arts and cultural industries in 2022.
The data demonstrates the significant contribution of the arts and cultural industries to the national economy in 2022 while also underscoring the continued impact of the pandemic on the sector. The Arts and Cultural Production Satellite Account (ACPSA) tracks the annual economic value of arts and cultural production from 35 industries—including both commercial and nonprofit entities.
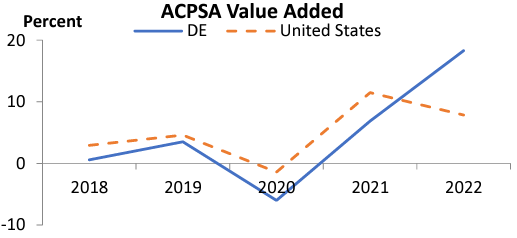
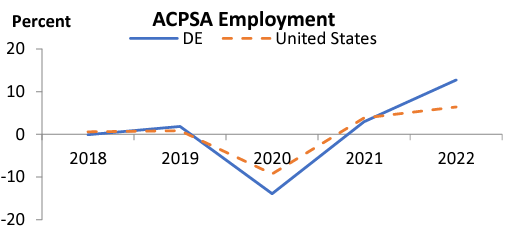
Between 2021 and 2022, every state and the District of Columbia saw growth in value added to their economies from arts and cultural industries, with 21 states showing increases of 10 percent or greater, when not adjusting for inflation. The added economic value from arts and culture surpassed 2019 levels for every state and DC. In terms of employment, although 45 states and DC have seen stable or growing arts and cultural employment from 2021 to 2022, only 20 states have reached or surpassed their 2019 levels.
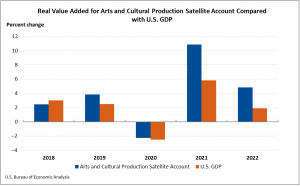
Despite setbacks for those industries, the overall national arts economy in 2022 represented 4.3 percent of GDP, or just over $1.1 trillion—a new high-water mark.
The U.S. Bureau of Economic Analysis reports that in 2022 arts and cultural production in Delaware accounted for:
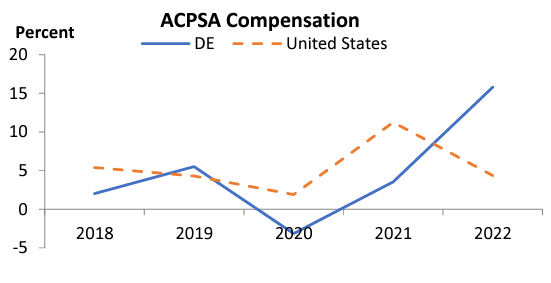
Trends in arts and cultural production: 2021—2022
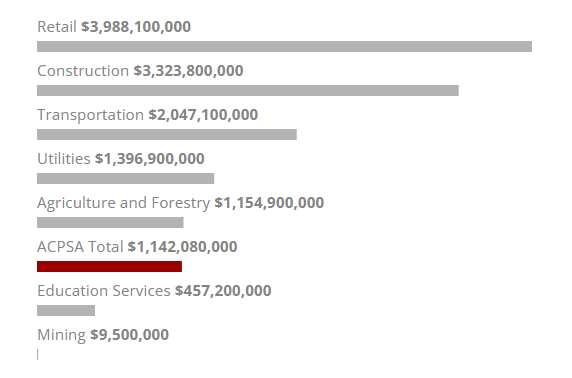
Comparing Arts and Culture to Other Sectors of the Delaware Economy
Arts and cultural Value Added in Delaware ranked 6th among the comparison sectors. Comparison industries are selected industry categories using the North American Industry Classification System (NAICS) drawn from BEA’s 2022 state level data for employment (full-time and part-time workers), compensation and value added by industry. The comparisons are not mutually exclusive—arts and culture includes, for example, portions of other sectors such as construction and retail trade.
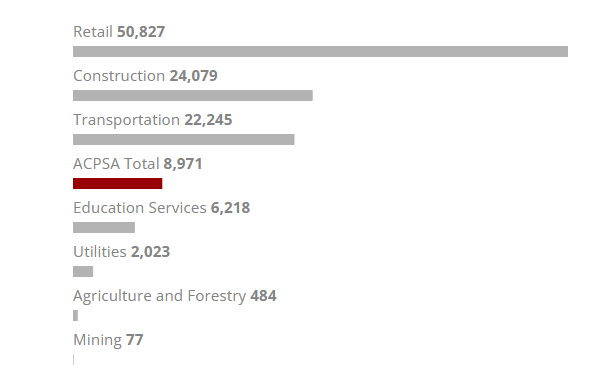
Arts and cultural Employment in Delaware ranked 4th among the comparison sectors. Comparison industries are selected industry categories using the North American Industry Classification System (NAICS) drawn from BEA’s 2022 state level data for employment (full-time and part-time workers), compensation and value added by industry. The comparisons are not mutually exclusive—arts and culture includes, for example, portions of other sectors such as construction and retail trade.
The NEA’s website details the findings in a number of resources, including a press release, national summary report, and state-level summary report.
BEA has produced ACPSA fact-sheets for each state.
The National Assembly of State Arts Agencies has created an interactive dashboard by state.
Carvel State Office Building
820 North French Street,
4th Floor
Wilmington, DE 19801
302.577.8278 |
302.577.6561
Email Us
FOIA Request Form
State Arts Council Intranet
Delaware's Governor
State Directory
Elected Officials
General Assembly
Delaware Courts
State Employees
Cities & Towns
Delaware State Code
State Regulations
Business First Steps
Phone Directory
Locations Directory
Public Meetings
Voting & Elections
Transparency
Choose Health DE
Tax Center
Personal Income Tax
Privacy Policy
Weather & Travel
Contact Us
Corporations
Franchise Tax
Gross Receipts Tax
Withholding Tax
Guides to Services
Help Center
Mobile Apps
E-mail / Text Alerts
Social Media

Built by the Government Information Center
©MMXXVI Delaware.gov